- ‘The Graph’ coin price prediction: a look at what the technicals say.
- Bulls are looking to continue their run as the 50 DMA is surpassed.
The Graph (GRT) is a blockchain technology built on the Ethereum network, specifically designed to collect, process, and store various types of data for different blockchain-based applications. As an open-source protocol, it supports 31 different Ethereum-based decentralized applications (DApps).
Founded by J. Pohlmann in 2018, The Graph’s token, GRT, was launched in 2020. The price of GRT experienced significant growth after increased trading volume. In February 2023, the price surged from $0.09706 to reach a peak at $0.2322.
However, the price faced strong resistance from sellers, leading to a decline to the levels of $0.141. Following a short-lived bull run, the price remained in a range between $0.1690 and $0.1322 until April 2023. During this time, a breakout occurred, causing the price to plummet back to $0.1090, returning to a similar level as in March 2023.
The Price on the Daily Charts
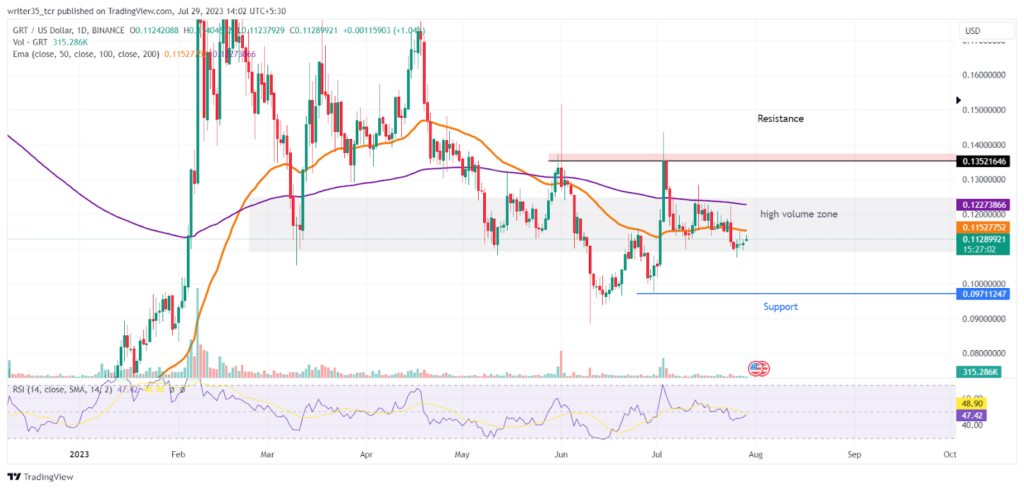
The price of GRT has been experiencing a prolonged consolidation phase, with this zone being highly respected by both sellers and buyers. However, on June 17th, the coin broke out of this consolidation zone and reached a high of $0.9711, which now serves as the current support level. The price tested this support again on June 30th before returning back to the consolidation zone.
A resistance is currently forming at $0.1352, which has also been tested twice in just one month, indicating its significance. The Relative Strength Index (RSI) at 47.38 shows that the fight between sellers and buyers is being closely monitored by market participants.
The price is currently below the 200-day moving average (DMA) on the daily timeframe, but it is close to the 50 DMA. Given the current volume levels within this zone, it is likely that the price will continue to consolidate unless it breaks the support or resistance levels discussed above.
The pricing on the 8 hour time frame shows a different story, as there are two support and resistance levels. The RSI shows that the stock is in the buy zone as it touches the level of 57, with the price a little above the 50 DMA this is confirmed.
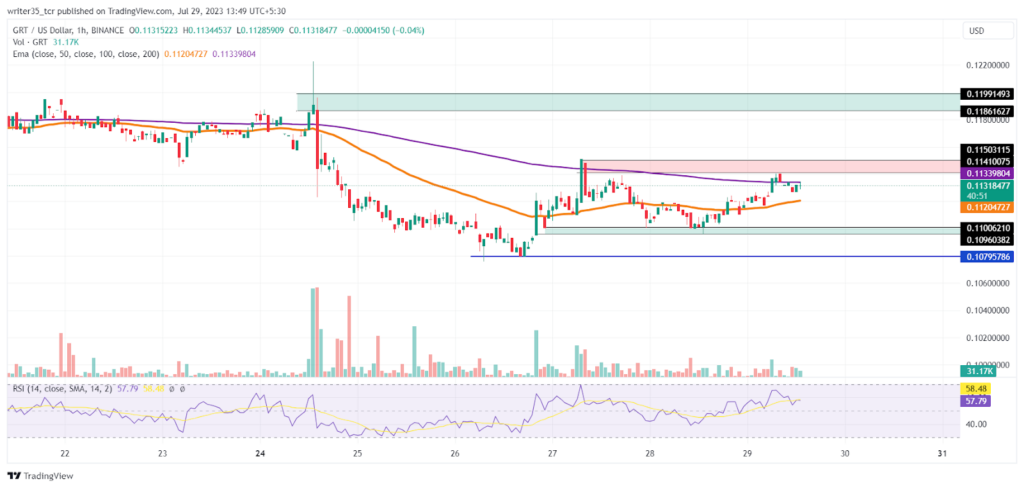
If the price reaches above the level of $0.1141 which is an immediate resistance, then bullish momentum will continue.
Conclusion:
The Graph, founded in 2018, is a blockchain technology that is built on the Ethereum network with the purpose of collecting, processing and storing numerous types of data for different blockchain-based programs.