- AAVE ERODED MORE THAN 90% OF GAINS FROM HIGHS.
- AAVE IS TRADING NEAR TO ITS 52 WEEK LOW LEVELS.
- THE PRICE IS UNDERPERFORMING AS THE PRICE DECLINED OVER 35 % IN A YEAR.
MARKET CAPITAL OF AAVE – $ 821.408 M
CURRENT MARKET PRICE OF AAVE – $ 56 .46
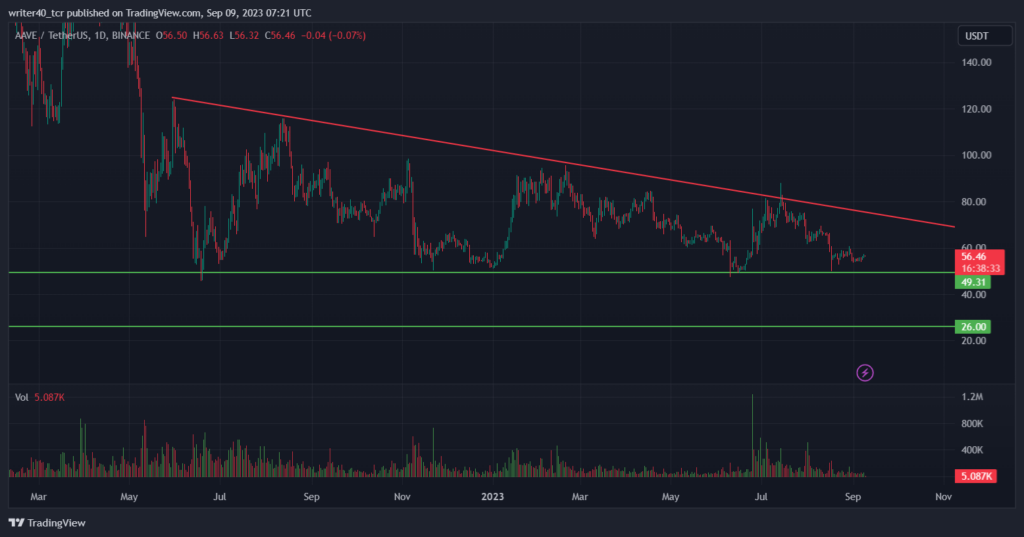
Soon after the listing Aave gave a wonderful return to its investors as the price surged more than 1000% in just 8 months and reached the levels $668 on 18th may 2021, since then the price shown a decline of over 90 % created a hole in the pocket of investors.
Aave decline in the lower highs and lower lows pattern forming a downward sloping trendline which is pushing the price down and currently the price is forming a falling wedge pattern on the daily chart where the resistance stands near $70 and support near $50.
The price is surely underperforming as the price is trading very close to the 52 week low levels of $ 47.30 which it made on 10 june 2023, although the price tried to show strength as the price boosted more than 80 % in one month but eroded all the gains and decline over 32 % off highs.


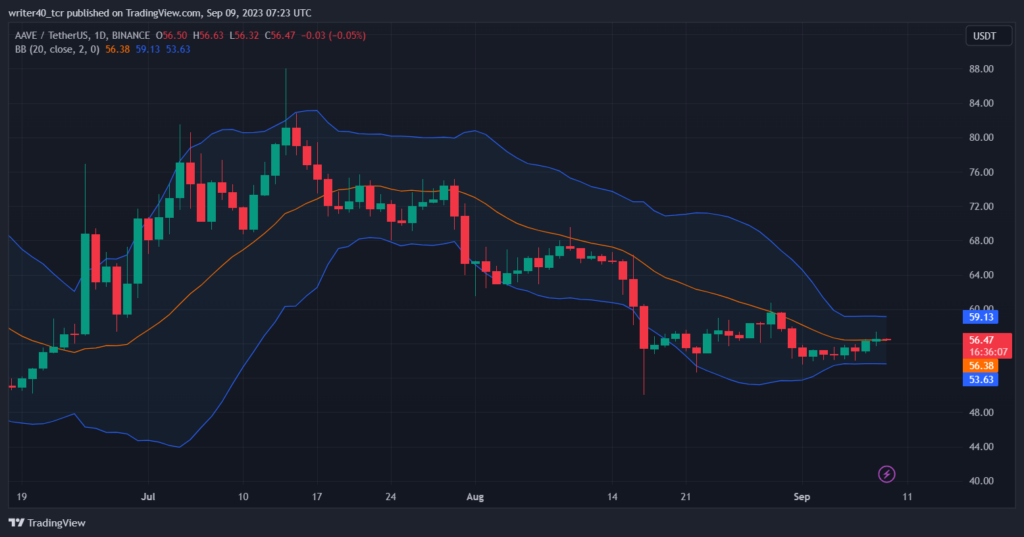
Bollinger bands is squeezing which indicates that the price is less volatile as of now and can move in tight range ahead where the lower level of BB stands at $ 53.6 which is also a demand zone and the higher level of BB is $ 59.13 which is a strong resistance as it is also near to the previous swing high .
WHERE AAVE CURRENTLY STANDS IN SHORTER TIME :-
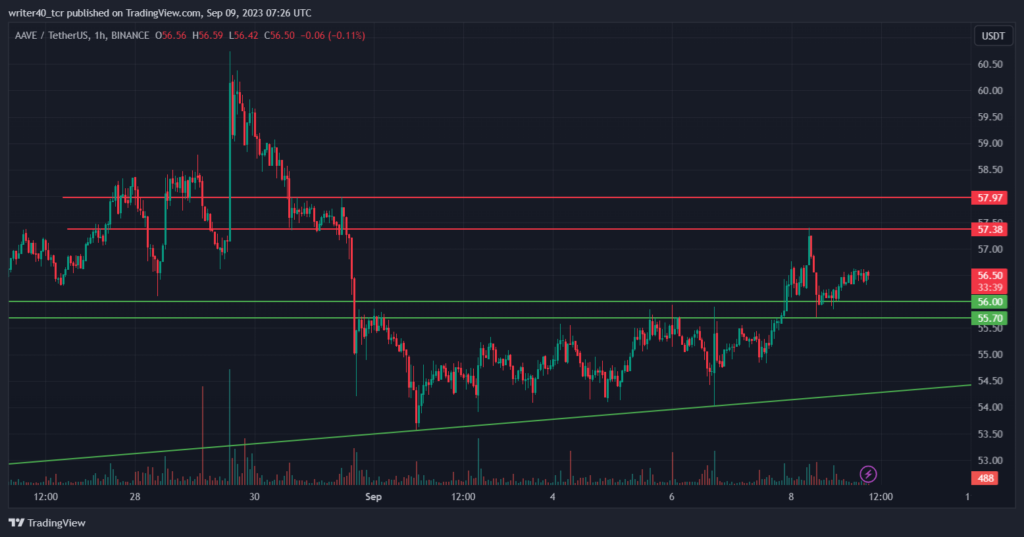
On 1 hour time frame Aave is trading above the resistance area i.e $ 55.70 – $ 56 of rising wedge pattern which it breaked on 7 september with heavy volumes indicates that the some heavy position is made there and this fact came true as the price shown a rebound from this level when it came to retest .
On 6th september Aave formed a bullish engulfing pattern and increased 1.32% in just one hour showing the presence of buyers and after the breakout went directly to the next resistance level which is present near $57 – $58 and the price fell sharply from that level shows that the sellers are still active.
CONCLUSION-
Aave is showing some strength at the support levels but the overall trend is down so we should watch the levels of $54 – $ 50 once this level breaks price can unlock the downside but if the price crosses $ 57 levels as mentioned in the chart above then market will try to attempt the upper levels of $60.
Aave formed a falling wedge pattern on daily time frame and if it breaks the lower level i.e $ 47- $45 then it can show some panic selling and will head toward the all time low level of $ 25.
TECHNICAL LEVELS :-
RESISTANCE- $ 59.60 AND $ 69 .80
SUPPORT- $ 55 AND $ 54
DISCLAIMER-
The views and opinions stated by the author, or any people named in this article, are for informational purposes only and do not establish financial, investment, or other advice. Investing in or trading crypto assets comes with a risk of financial loss.


