- MO stock surged 1.70% in a week, 2.17 in a month and ( -0.70) % in a year.
- Revenue is on a flatter note, net income expected to rise , EPS expected to follow the same path.
- Net debt of the company is still on the higher side, which remains the concern for the company.
Market capital of Altria group – $ 79.41 B
Current market price of Altria – $ 44.75
Is MO a good stock to buy?
MO stock has formed a double top at $50 which makes it a strong resistance zone for the stock. The revenue of MO company is flat since 2016 which indicates that the company is struggling to grow. Although the net income of the company is slowly rising which is a good sign for the company .
Net debt on the company is very huge in respect of the cash and reserves of the company. The cash and cash equivalent is currently at $4.04 B and Net debt of the company is $ 22.64 B. 6 times net debt over cash and cash equivalent is an alarming sign for the company. Company is managing the margins perfectly which is good .
The expected revenue of the company is still flat at $20.70 B. Net income can increase by about 18% which is good as the revenue is flat. EPS can also rise by over 19% which is a good number in financials. Company is providing a dividend yield of 8.05 % which is not a great but a satisfactory number.
Technical analysis of MO

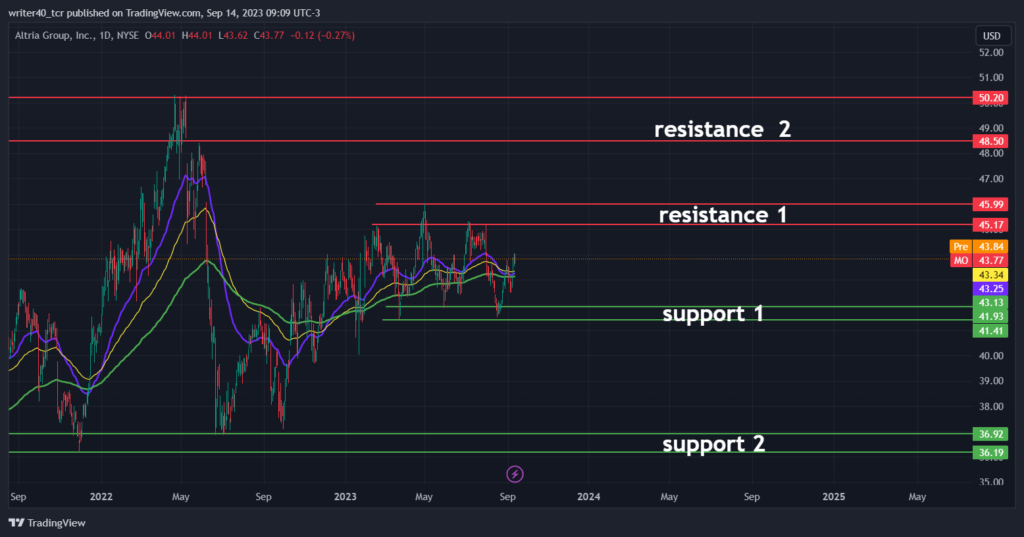
On the daily chart the stock is consolidating away from both the higher and bottom zone as the price is consolidating in the middle. The EMA is flat which supports the above statement and price is trading above the EMAs. The price is currently forming a range where it has been consolidating since JAN 2023.
The resistance on a short range is present at $ 45.17 and $ 45.99. The support is present near to the levels $41.93 and $ 43.13 . If we talk about the longer range then the price has faced a rejection from $50 twice. The demand zone has tested twice and is present at $36.92 and $36.19 respectively.

https://www.tradingview.com/chart/ruBma0Io/?symbol=NYSE%3AMO
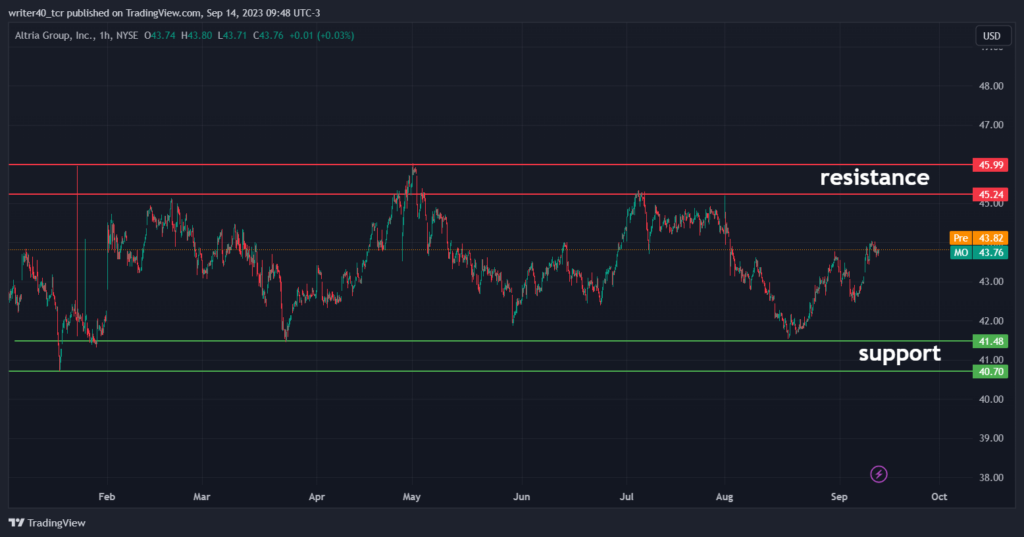
On an hourly time frame the price is consolidating in a tight range of $45.24 – $ 45.99 on the higher side. On the lower side the price has been pushed upward from $ 40.70 and $ 41.48 multiple times.
The only reason visible for such price action is the poorly performing financials. And the price is waiting for a surprise on either side.
Conclusion
If the market breaks the range on upside then it can make significant moves towards $50 and up. And if the price breaches the lower levels then it will unlock the downwards levels of $37 to $36.
But as per the current movement of price we can say that the market is waiting for a surprise on financial terms.
Technical levels
Resistance – $45.24- $45.99
Support – $ 41.48 – $40.70
Disclaimer
The analysis is done for providing information through technical analysis and no investment suggestions are given in the article to be made by investors. The coins are unpredictable so investors should have proper knowledge. Cryptocurrencies are highly volatile and risky. Investment should be made with proper technical analysis


