- MAR has surged 1.09% in a week, (-1.04%) in a month and 29.25% in a year.
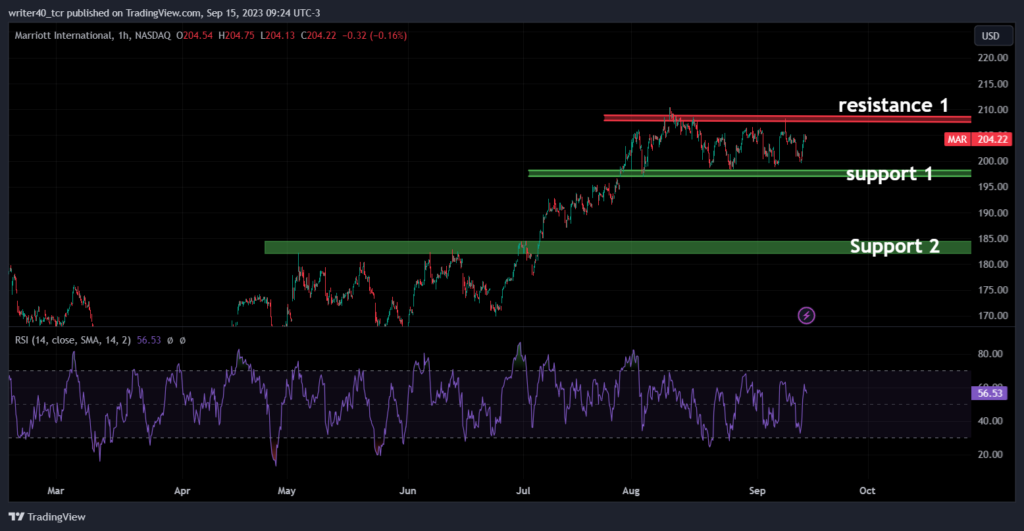
- MAR stock price is trading in a range of $10 since 28 July 2023.
- MAR stock price is trading above both the important EMAs i.e. 50 and 100.
Market capital of MAR – $60.90 billion
The current market price of MAR – $204.21
MAR’s price is trading near its 52-week high level of $210.45 and currently consolidating in a range of $10 from 28 July at higher levels. The price consolidation at higher levels means the price is kicking out the sellers at the upper zone. The volumes are flat at these levels which means the price is ready to move upward after some consolidation.
The revenue of the company has been rising since 2020 and the Trailing Twelve months (TTM) indicates that the company is going to post one more strong financial. The net income of the company is also rising but at a better growth rate as the Net income jumped more than 117% last year which is a very positive sign for any company.
The EPS of the company is also rising at a very good pace as the EPS has risen from -0.82 to 7.24 in 3 years which means the price is very bullish. The net debt of the company is also flat and rising slowly which must be a matter of concern for the company. The cash and receivable of the company is much below if compared with the net debt.
The company has proven inconsistent over the dividend payout as the company’s dividend yield in 2019 was 1.22% and in the next 3 quarters it has given 0.36%,0.00% and 0.67% in the next three years. The company maintained the net margins over the period and it is a good sign for a company.
Technical analysis of Marriott International (MAR)

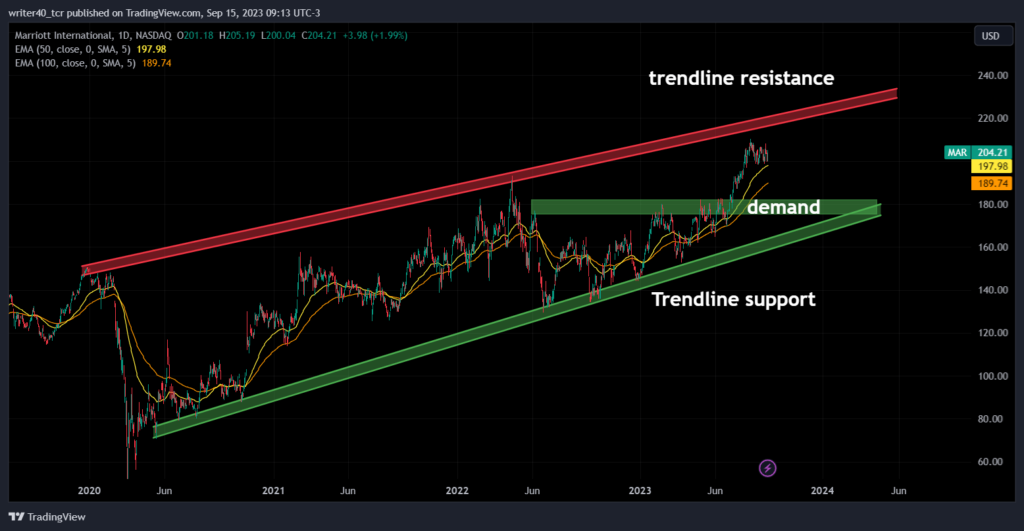
On a daily time frame, the stock is currently trading in a rising wedge pattern and within it, the price has also formed a demand zone as drawn in the above chart. The price is taking strong support from the rising trendline which is present near the $168 level. The upper trendline resistance is present near $220.
The demand zone is present near the $180 level which previously acted as a resistance.
The price is currently trading above the 50 and 100 EMA which is a sign of bullishness in the stock. The EMAs i.e. 50 and 100 are present at $189 and $198 which can provide necessary support to the price.
On an hourly time frame, the stock forms a range between $198- $210 and has been trading under this range for so long. The crucial resistance level is present near the $210 level i.e. 52-week high of the stock. The support is present at the $198 level and the crucial support is present near the $183-$185 level.
Conclusion
If the price crosses and sustains above the $210 level then the price can show some strong upmove. The price is in an overall bullish trend which will help the buyers to enter into a long position confidently. If the price breaches the recent support zone then it can head towards the $185 level.
Technical levels:-
- Resistance – $ 210
- Support – $198
Disclaimer
The analysis is done for providing information through technical analysis and no investment suggestions are given in the article to be made by investors. The coins are unpredictable so investors should have proper knowledge. Cryptocurrencies are highly volatile and risky. Investment should be made with proper technical analysis.


