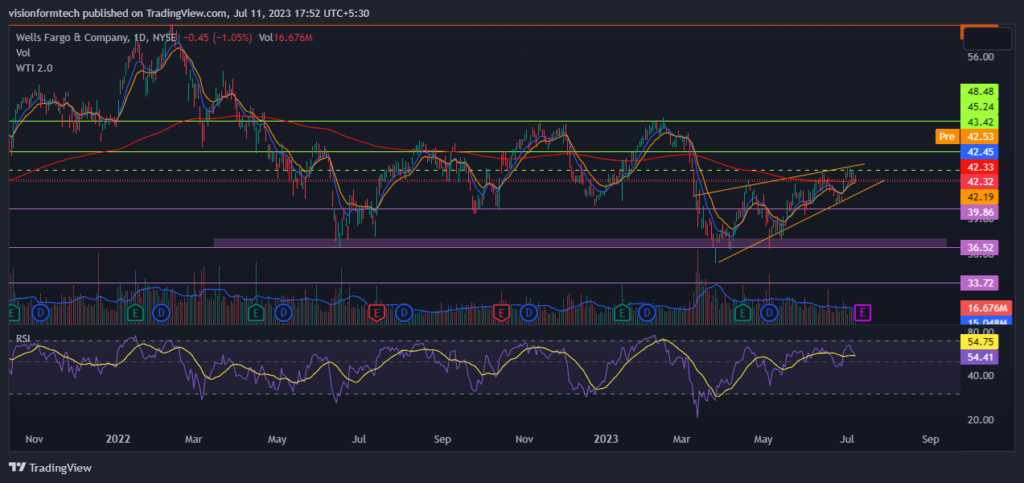

Wells Fargo & Company’s (NASDAQ: WFC) price prediction highlights the sideways price action of the WFC stock since June 2022. The WFC stock price is trapped between the range of $48.48 and $36.52 for the past one year. The bulls made a second attempt to break the resistance in February 2023. It was followed by a rejection and a downfall of 24% in support. Since then the WFC stock price has recovered 15.66% to its current market price.
At the time of writing, Walt Disney Company. closed its trading session on Monday, 10th July 2023 at $42.32. The market closed with a decline of 1.05% from the last trading session


Source: WFC 1D Chart by TradingView
The Wells Fargo & Company(NASDAQ: WFC) stock price prediction reveals that the bulls are trying to push the price from the support. The WFC stock price is developing a rising wedge pattern. Another observation is that the volume is declining as the price rises. This creates a divergence between rising prices and declining volume.
Such a condition is developed when the trend is about to reverse. The rising wedge patterns usually break towards the downside. Therefore a breakdown may drag the price down to the support or below it. Also, The price is getting reversed from the local resistance of $43.42.
Source: WFC 4-Hour Chart by TradingView
A closer look at the 4-chart clearly shows the market structure of a rising wedge pattern. The recent rejection of the local resistance may lead to the formation of a double-top pattern. The WFC stock price may continue its recovery if the bulls manage to hold the lower trendline of the pattern.
The technical indicators are pointing at the losing momentum. The WFC stock price is above the 200 EMA which can help the price to up in the short term. But the declining buying volume and increasing selling volume are hinting at a reversal. It would be wise to wait for the price break below the rising wedge.
RSI: The RSI indicator is currently at 51.23 on the 4-hour chart. The RSI indicator has crossed the MA towards the downside. The price may start declining quickly if the indicator goes below 50
MACD: MACD is about to make a bearish crossover. The Indicator is floating above the 0 line. The price may consolidate in the short term until the indicator crosses the 0 line
200 EMA: On the 4-hour chart, the price is trading above the 200 EMA. This is a bullish sign and an indication of bullish dominance. The 200 EMA acts as a dynamic support and the prices may continue to move up until the price breaks below the indicator.
The Wells Fargo & Company(NASDAQ: WFC) stock price prediction reveals that the bulls are trying to push the price from the support. However, the recovery is not supported by strong bullish momentum. Instead, the WFC stock price is forming a rising wedge pattern. The investors are advised to exercise caution especially if the price breaches the trendline. This may lead to a further downfall.
The views and opinions stated by the author, or any people named in this article, are for informational purposes only and do not establish financial, investment, or other advice. Investing in or trading crypto assets comes with a risk of financial loss.
Token airdrops have historically introduced investors to new blockchain projects. However, many distributions fail to…
Airdrops have traditionally been used to introduce new investors to blockchain projects, but their effectiveness…
The approval of Bitcoin ETFs was one of the most anticipated events in crypto history,…
The blockchain space continues to evolve, with projects pushing security, scalability, and user engagement to…
As the cryptocurrency market recovers from recent volatility, several projects emerge as strong contenders for…
The cryptocurrency market is showing strong bullish signals, with many altcoins poised for significant gains.…
This website uses cookies.