- BlackRock made 505.21 level its major support.
- NYSE: BLK is rallying in an uptrend trying to reach the 764.07 level.
- BlackRock stock price is trading at the 200-day EMA.
On 13 October 2022 the BLK stock price took a major support at the previous demand zone at the 505.21 level. The stock price is currently trading in an uptrend from that level. The buyers are still waiting to put their money near the required demand zone.
BlackRock stock price is rallying toward the 764.07 level, because of the demand in major zones. On the other hand, sellers are still trying to sell at resistance levels. However, the overall stock structure is in an uptrend, they cannot sell for the long term.
The stock price continuously dropped for several weeks, but buyers took their interest at the 665.18 level. From that point they pushed the price upwards. The sellers must be cautious about demand levels otherwise they may lose profits.
BlackRock Stock Price Trading In Uptrend
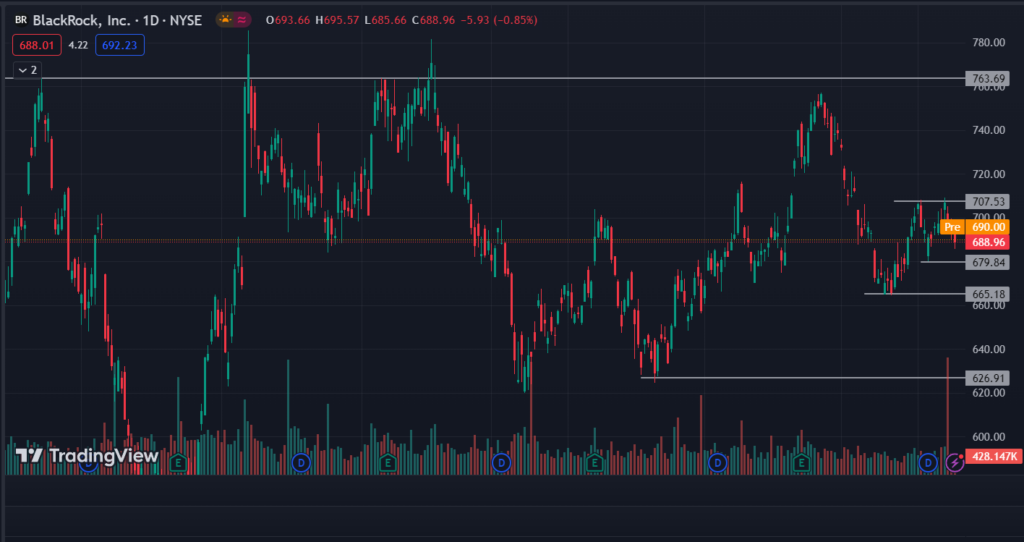
On 15 March 2023, buyers started an impulsive rally to the range of 699.16. From that point stock price was continuously swinging high but sellers were sitting between the range of 742.16 to 763.69. They successfully dropped the stock price to its previous demand zone.
As we can see, if the buyers become successful in breaking out the 707.53 level, we can assume the uptrend is more likely to continue till the 763.69 level.
In the volume chart, the bearish volume is increasing but without adapting to the change in character. It shows bears are not fully interested in taking trades.
What Technicals Says About the BLK
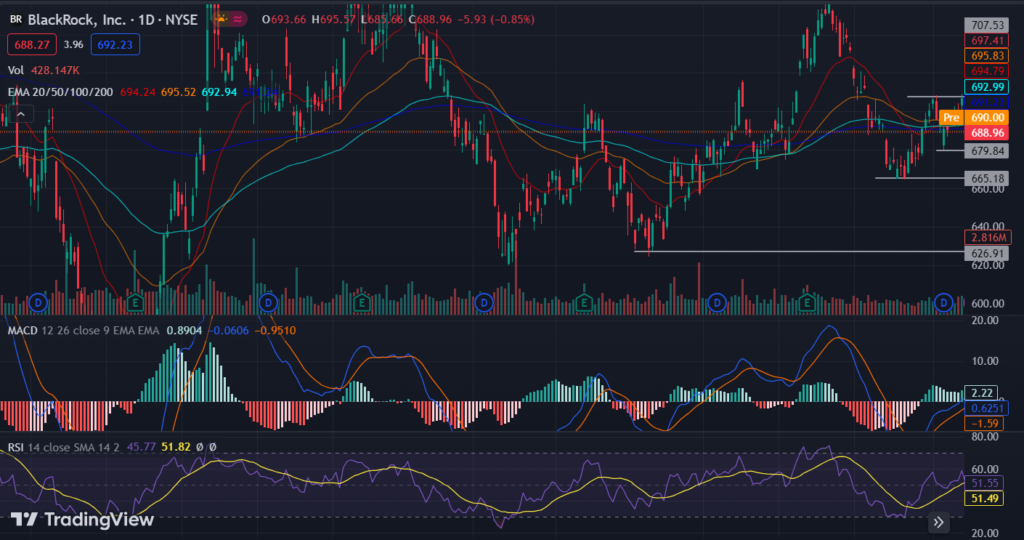
The BlackRock stock price is trading at 688.96 nearly all the EMAs. The 20-day, 50-day, 100-day, and 200-day EMAs are at 694.24, 695.52, 692.94, and 691.24 levels respectively. The stock price dropped down to the 665.18 level during that session all the EMAs were above the stock price.
Now, the EMAs and price are getting close to each other and indicate that the price will continue its uptrend.
On the other hand, the MACD line at 0.0606 with the signal line at -0.9510. That indicates the volume of bullish move is increasing and now the indicator signal line is also averaging near the buy volume chart.
Relative strength index (RSI) is strengthening in a bullish direction. These lines are averaging at 51.55 and the signal line at 51.49. As the strength shows that the stock price touched the oversold zone 3 times, indicates that the price will reach up to 70 upper band.
BlackRock, inc. Stock Price Chart Supertrend
Technical Levels
- Resistance Levels: 707.53 and 763.69
- Support Levels: 677.23 and 650.26
Disclaimer
The views and opinions stated by the author, or any people named in this article are for informational purposes only. They do not establish financial, investment or any other kind of advice. Investing in or trading in stock may come with a financial loss.