
- The price of Optimism OP is trading at $1.37.
- The 24-hour volume is $883.66 M which decreased by 30.21% in 24 hours.
- Optimism OP price has decreased by 7.24% in today’s market.
Introduction
Optimism (OP) is a kind of cryptocurrency. It rather a layer-2 scaling solution for Ethereum known as Optimistic Ethereum. It tries to elevate the Ethereum blockchain’s scalability and excessive transaction costs by employing a mechanism known as Optimistic Rollups.
Optimistic Ethereum employs a sidechain structure in which many transactions are aggregated into a single batch and then a summarised proof of those transactions is sent to the Ethereum Mainnet. This method enables faster and cheaper transactions while benefiting from the Ethereum network’s security and decentralization.
Optimistic Ethereum’s fundamental premise is to execute most transactions off-chain while preserving their validity and integrity through a mechanism known as optimistic execution.
Trend Analysis
Optimism (OP) price activity over the most recent period suggests that it was in a downtrend momentum but now the price is respecting the support level and consolidating nearby from the last 2 weeks. The price of Optimism (OP) fell around 79% in just 20 weeks. The value of the coin has decreased significantly over time. However, now the price is trading at a very important level.
Optimism (OP) Price Analysis
Technical Analysis (1W Timeframe)
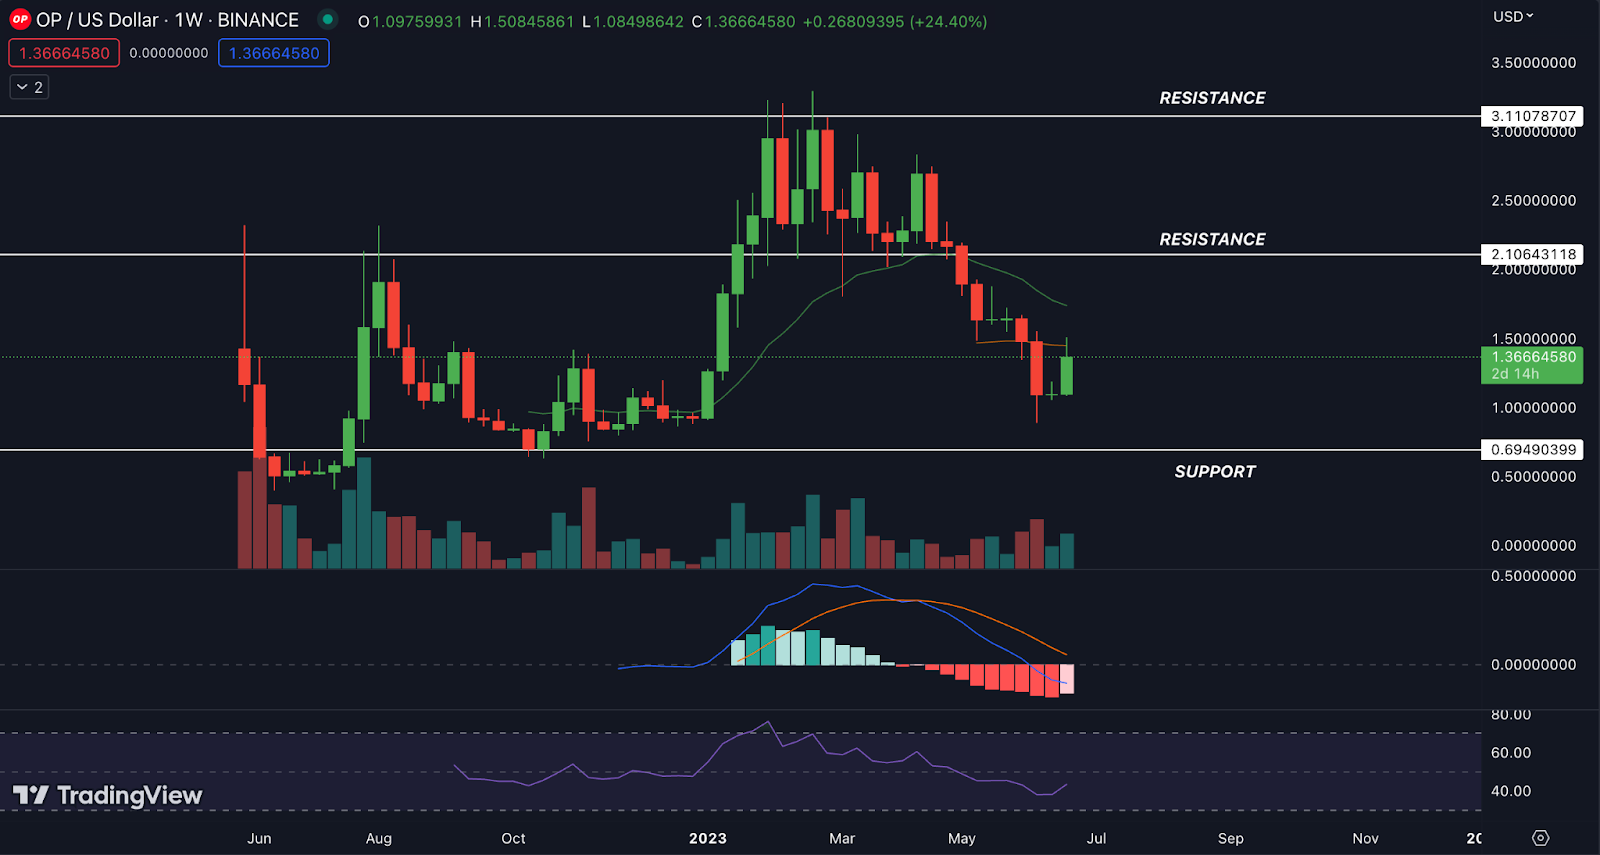
EMA: THE Optimism OP price is currently trading below the 20 EMA, which indicates that the price is favoring downtrend momentum and weakness in the crypto.
RSI: The RSI for Optimism (OP) in the daily timeframe is currently close to 50, indicating that buyers and sellers are currently in a relatively balanced position. This indicates that neither side is significantly dominant and may portend a time of market consolidation or hesitation.
MACD: The MACD is said to be bullish when the signal line crosses it from below. The indicator is regarded as bearish when the MACD line crosses the signal line from the region mentioned above.
In the weekly timeframe, the MACD line for Optimism (OP) is currently below the signal line. This bearish crossover shows that there may be more selling pressure than buying pressure, which may portend a positive view for the price of Optimism (OP) shortly.
Conclusion
According to the analysis, the indicators are supporting the movement on the bearish side in a short time. If the price breaks the EMA level with good volume we can expect further up move. Currently, the overall trend of the Optimism OP in downtrend and indicator like MACD and RSI is giving a negative signal.
Technical Levels
- The Nearest Support Level is – $0.694.
- The Nearest Resistance Levels are – $2.1064 and $3.1107.
Disclaimer
The views and opinions of the author, or anyone named in this article, are for informational purposes only. They do not offer financial, investment, or other advice. Investing or trading crypto assets involves the risk of financial loss.